County Map
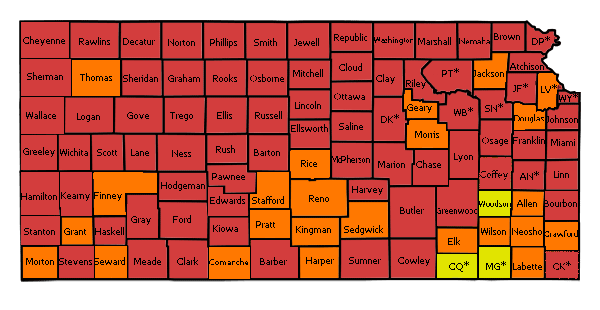
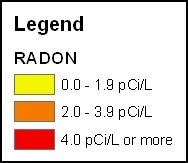
Average Radon Level = 4.6 pCi/L
Maximum Reported Radon Level = 1,121.6 pCi/L
Total Number of Measurements = 161,690
Total Measurements 4 pCi/L or greater = 62,555
Total Measurements 20 pCi/L or greater = 3,296
Tota Estimated Mitigation (2005-2018) = 33,066
Copyright 2018, KDHE and Kansas State University. Caution: This map has been produced using data collected by KDHE through June of 2018. As further data becomes available, revision will be necessary. This map is provided free of charge to the public and is generated for study purposes only. Permission is hereby given to reproduce this map provided it is reproduced in its entirety without modification. This map cannot be used to characterize or predict indoor radon levels at any specific area or location. Measurement must be performed to determine radon levels in any given residence or building. Contact the Kansas Radon Program at (800) 693-5343.
National Environmental Public Health Tracking Network Data Explorer
Additional maps of radon and Kansas geology, lung cancer incidence, and smoking prevalence
Download All County Maps (zip file)
* Abbreviations:
| Abbreviation | County |
|---|---|
| AN | Anderson |
| CK | Cherokee |
| CQ | Chautauqua |
| DK | Dickinson |
| DP | Doniphan |
| JF | Jefferson |
| LV | Leavenworth |
| PT | Pottawatomie |
| SN | Shawnee |
| WB | Wabaunsee |
| WY | Wyandotte |